

Try, Try Again...
Seventh Grade Poster Problem:Statistics and Probability
This problem is designed to help students use ratio language and concepts by focusing on a single compelling problem context – making chocolate milk. Questions in this problem use both part-to-part ratios and part-to-whole ratios.
Downloadable Materials
Learning Objectives:
- Understand the concept of ratio and use ratio language to describe a ratio relationship between two quantities.
- Use ratio and rate reasoning to solve real-world and mathematical problems.
Common Core State Standards for Mathematics:
- 6.RP.A.1 and 3
1. LAUNCH
Engage students in a discussion about probability. You do not need to explore all of the following questions. Mainly, we want to establish that a probability is a number between 0 and 1, and get some intuitive idea about what the values mean.
- What does “probability” mean? [Students share ideas. Make sure they understand that probability is a number between 0 and 1. You can express it as a fraction, a decimal, or a percentage.]
- What does a probability of zero mean? (it will never happen) What about a probability of 1.0? (it’s certain to happen.)
- The teacher comes up with likely or unlikely things of local interest, and asks students to guess the probability. For example, in Los Angeles, if you ask, what’s the probability of snow tomorrow, you should get a low number. Or, what’s the probability that the principal will walk in during the next ten minutes? What’s the probability that Jake here will have peanut butter for lunch? The probability that Sylvia (the star girls’ basketball player) can sink a basketball shot from the free-throw line?
- Ask students to come up with events that have a high/low probability.
You could then ask about something more sophisticated, but qualitative:
- Return to a repeatable example (e.g., something that was likely, like Sylvia the free-throw shooter) and ask about its happening twice. Is that probability the same, higher, or lower, than it happening once? (lower, always) Example: Suppose we know the probability that Sylvia sinks a basket. What’s the probability that she sinks two in a row? Is that higher, lower, or the same?
Having taken time with generalities in a context, now choose questions like the following to get specific and quantitative.
- If you flip a coin, what’s the probability of “heads”? (one-half) How do you know? (Heads and tails are “the same.” This answer uses the important insight that the probabilities add to one.)
- If you roll a die, what’s the probability of getting a three? Again, how do you know? (⅙, because there are six faces on the die and they all come up the same amount. Official language: they’re equally likely.)
- If you roll a die, what’s the probability that you get an odd number? (½) How did you get that? (There are three odds and three evens among six possibilities. So the probability is 3/6, which is ½.)
- If you roll a die 60 times, how many threes do you expect to get? (Answer: 10, since on average, you roll a 3 one-sixth of the time.) Note: using the class as a whole to help, you might actually do this, and find out that you generally don’t get exactly what you expect.
- Suppose you have a paper cup and flip it in the air. What’s the probability that it lands on its side? Don’t know? What could you do to figure it out? (You can’t use the same reasoning as the die. So all you can do is flip the cup many times and see what you get.)
- Suppose you have a fair coin and flip it twice. What’s the probability that you get two heads? (The chance of the first head is ½. To get that and the second head is half of that, or ¼. This is advanced, and the whole point of the activity—so get students thinking, but don’t linger!)
2. POSE A PROBLEM
Student responses in the “Launch” will give you an idea what the students can do and what they’re clueless about. Although students will work in groups—and can therefore work together to help figure things out—you might need to give them some help with the following, either beforehand, or (ideally) at the moment they need it.
- Distribute Handout #1(“Steve Shoots Two”). In the handout, Aloysius says that Steve has a probability of 1/3 to make both shots. Handout #1 Answer Key
- Every student gets a standard die, numbered 1 to 6.
The task is to explain why Aloysius is wrong—using two different approaches. The first is theoretical: students should make a diagram or systematic list. The second is empirical: they should simulate Steve going to the free-throw line many times.
Here are some questions you can ask to help students as they work. As a general question,
- What is the probability that he makes his first shot? (½ or 50%)
- Now ignore the first shot. What’s the probability he makes the second? (the same: 50%)
Then, for the “theoretical” part, you might ask the following (with the most general questions first, more “leading” later).
- What are the different possible things that can happen when Steve shoots twice?
- What are the different possibilities for his first shot? What are their probabilities?
- Suppose Steve took these two shots 100 times. Of those 100 pairs of shots, how many times will he make his first shot? (50) And out of this, how many times will he make his second shot? (25) So what’s the chance that he makes the first shot and makes the second shot? (25 out of 100, or 25%, or 0.25, or 1/4)
- Explain what Aloysius was thinking. Why is his approach wrong?
For the “empirical” part, you might ask the following.
- What do you suppose it means to simulate his shots? (Important: To solve this problem, do not crumple up a piece of paper and try to pitch it into the wastebasket. Why not? Because you can’t guarantee that your shot will hit an average half the time.)
- How could you use your die to simulate his first shot? How could you make the probability ½? ( Note that they could use even/odd, or 1-2-3 for miss, etc.)
- Show me how to simulate one time when Steve takes two shots. What’s the overall result? How many points did he get?
- How are you recording your data?
- How many trials do you think you need?
Upon completion of handout,
Show Slide #1.
Have students compare theoretical approaches to what the they did.
Use Slide #2
to compare an empirical approach to what they did.
Warning!
Some groups will probably get empirical results close to Aloysius’s wrong answer from the handout, ⅓. Students need to learn that simulation naturally gives variable results. If you combine the class data, however—putting all their simulated shots together—you get a larger sample, and it will (probably) agree better with theory.
Students need to learn that variability due to randomness is often much more “random” than we expect. See the Teacher Tuneup on variability and what randomness looks like.
3. WORKSHOP
Show Slide #3
that contrasts the “Two Approaches.” Explain that this slide is for the Steve problem that the students just did. You can always try to use both approaches, but sometimes only the second one is possible.
Now you’ll try to apply what you did with Steve to a new problem in a new context.
Distribute Handout #2, “Penelope’s Group.”
Handout #2 Answer Key
Here is the relevant text:
Penelope works in a group with Quentin, Rochelle, and Sid.
The teacher always chooses a group member at random to present the group’s solution to the class. On this day, Penelope’s group has to present twice.
What’s the probability that the same student gets chosen both times?
Ask students if they have questions. Here’s an issue that will likely come up: even if you’ve been chosen before, the chance that you’ll get chosen again is the same. You don’t get any immunity!
If you’re worried that students might not understand the task, ask questions like these before they get started:
- What is the probability that Penelope gets picked for the first solution? (1/4)
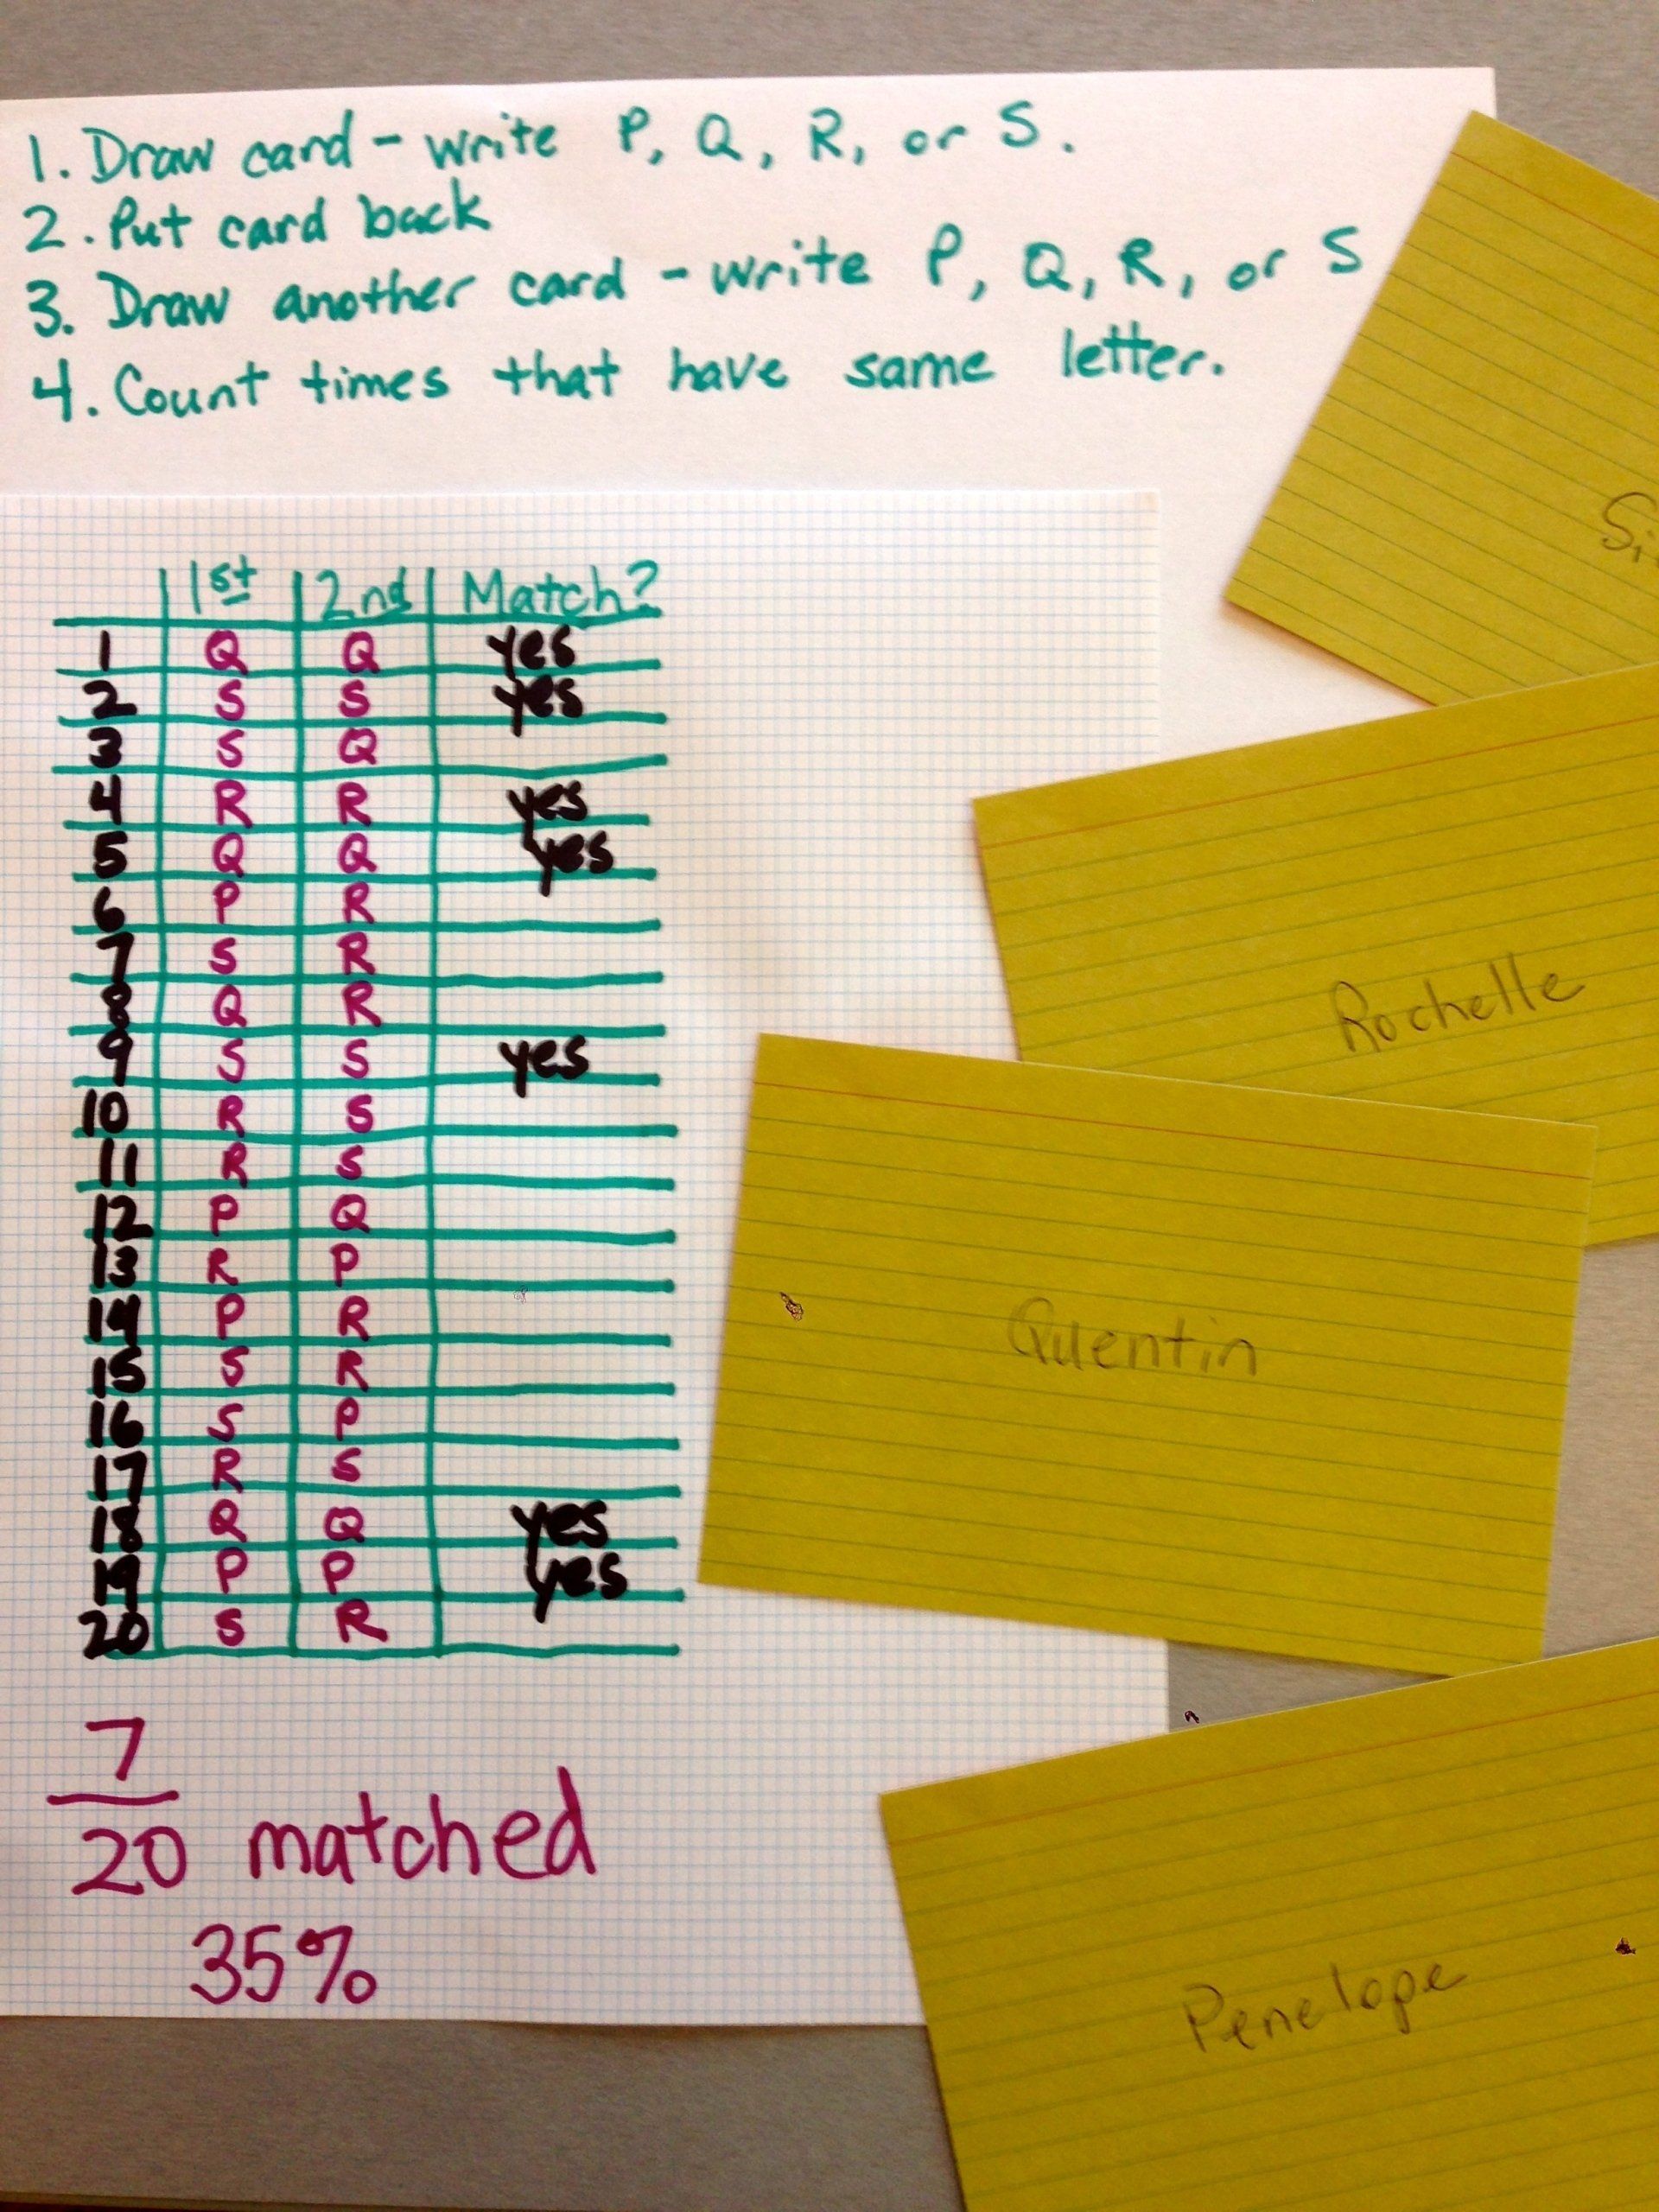
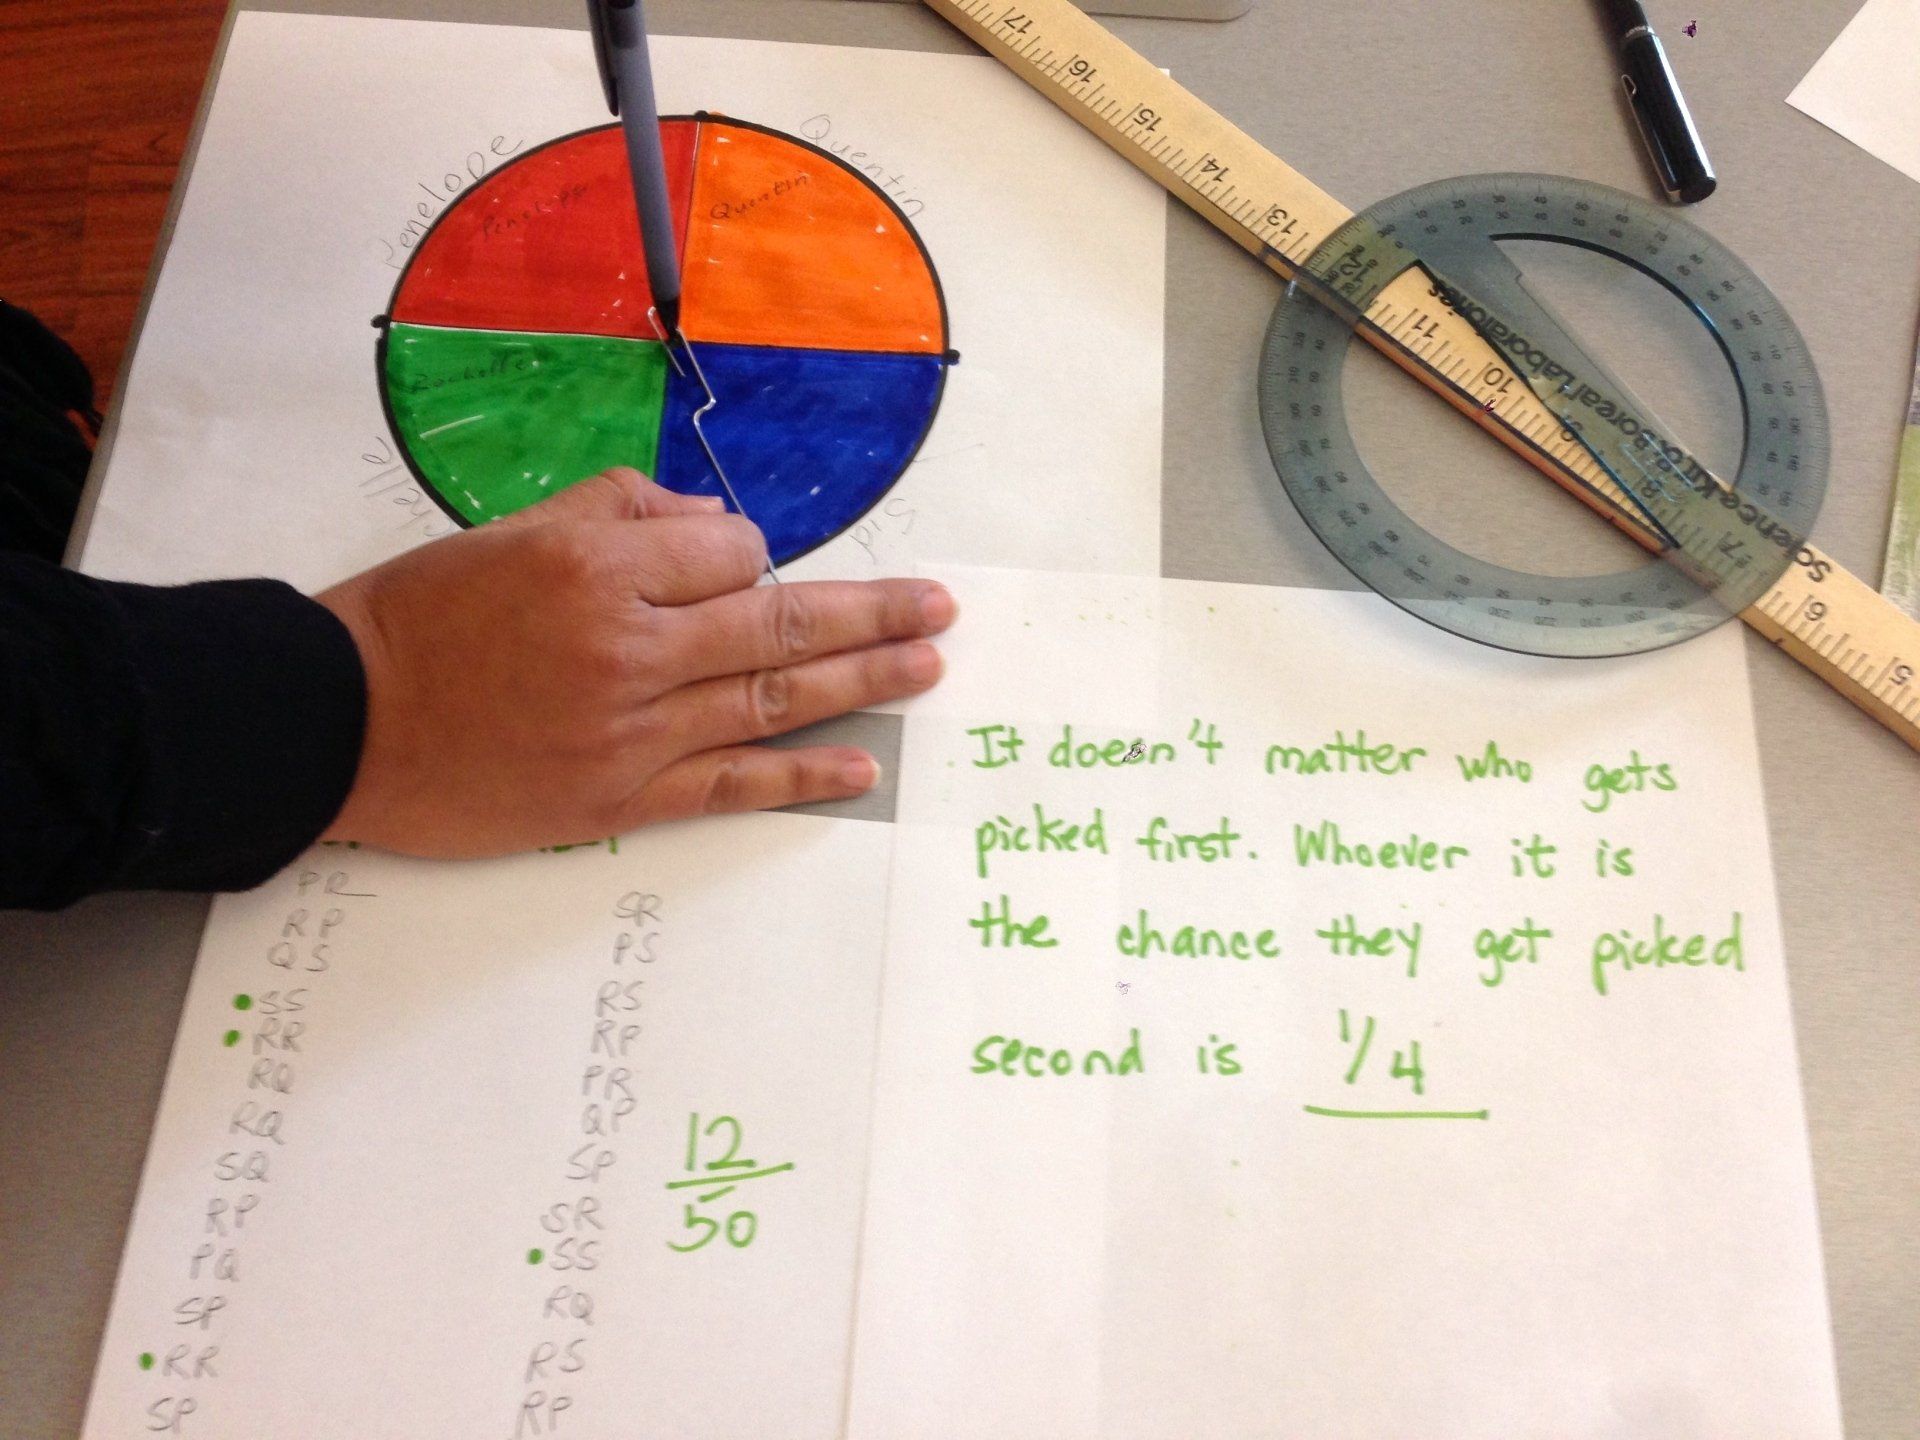
- How would you simulate picking one student? (Many possible answers. Get several: roll a die but re-roll if you get 5 or 6; make cards with the names, shuffle and pick; make a spinner with a paper clip. To prompt, ask, “Could you use a number cube?” and ask for the procedure: how would you use the roll? How would you make sure it’s fair?)
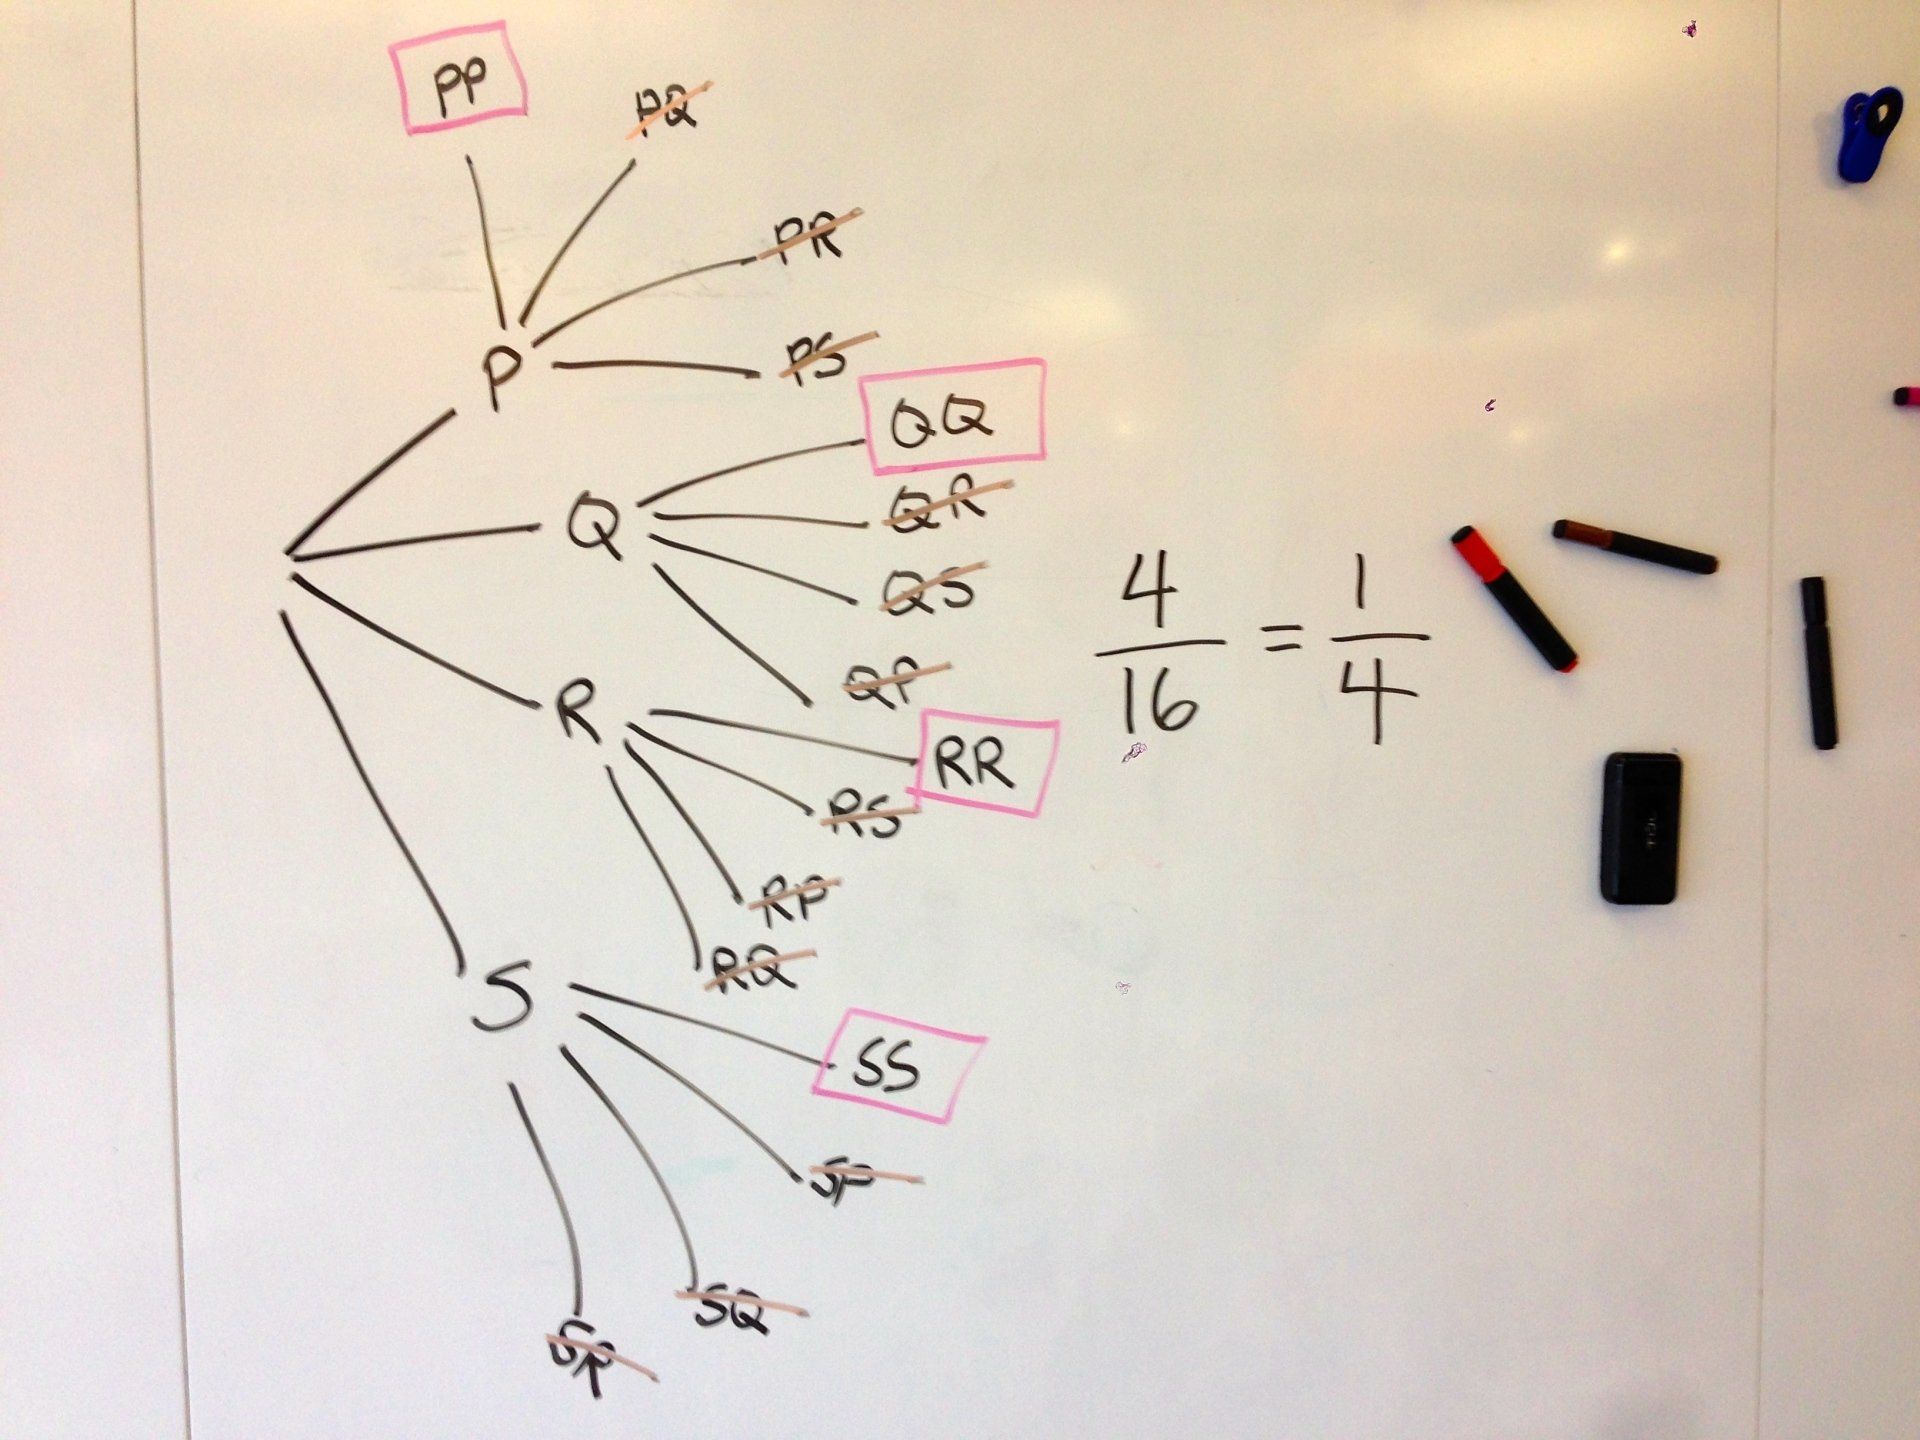
Note: Some successful groups will get the answer 1/16. Chances are excellent that they are answering the question, “What is the probability that Penelope gets chosen both times?” After probing gently to verify that this is the case, simply ask, “Are you sure you’re answering the question that was asked?”
4. POST, SHARE, COMMENT
Sample Posters
What Can Go Wrong
Probability can be a hard topic at this level, and the Core Standards are very demanding. Some groups will make mistakes and not get the “right” answers. Make sure you are aware of the following.
In the empirical process, students may just say, for example, “There are two possibilities: match and no match. So we’ll roll a die and use 1, 2, and 3 for a match; and 4, 5, and 6 for no match.” Ask these students to talk with another group about their procedure. If necessary, tell them to try it by simulating each question separately, so you can tell who was called each time (just as we did the two shots separately for Steve), and compare their results to their first plan.
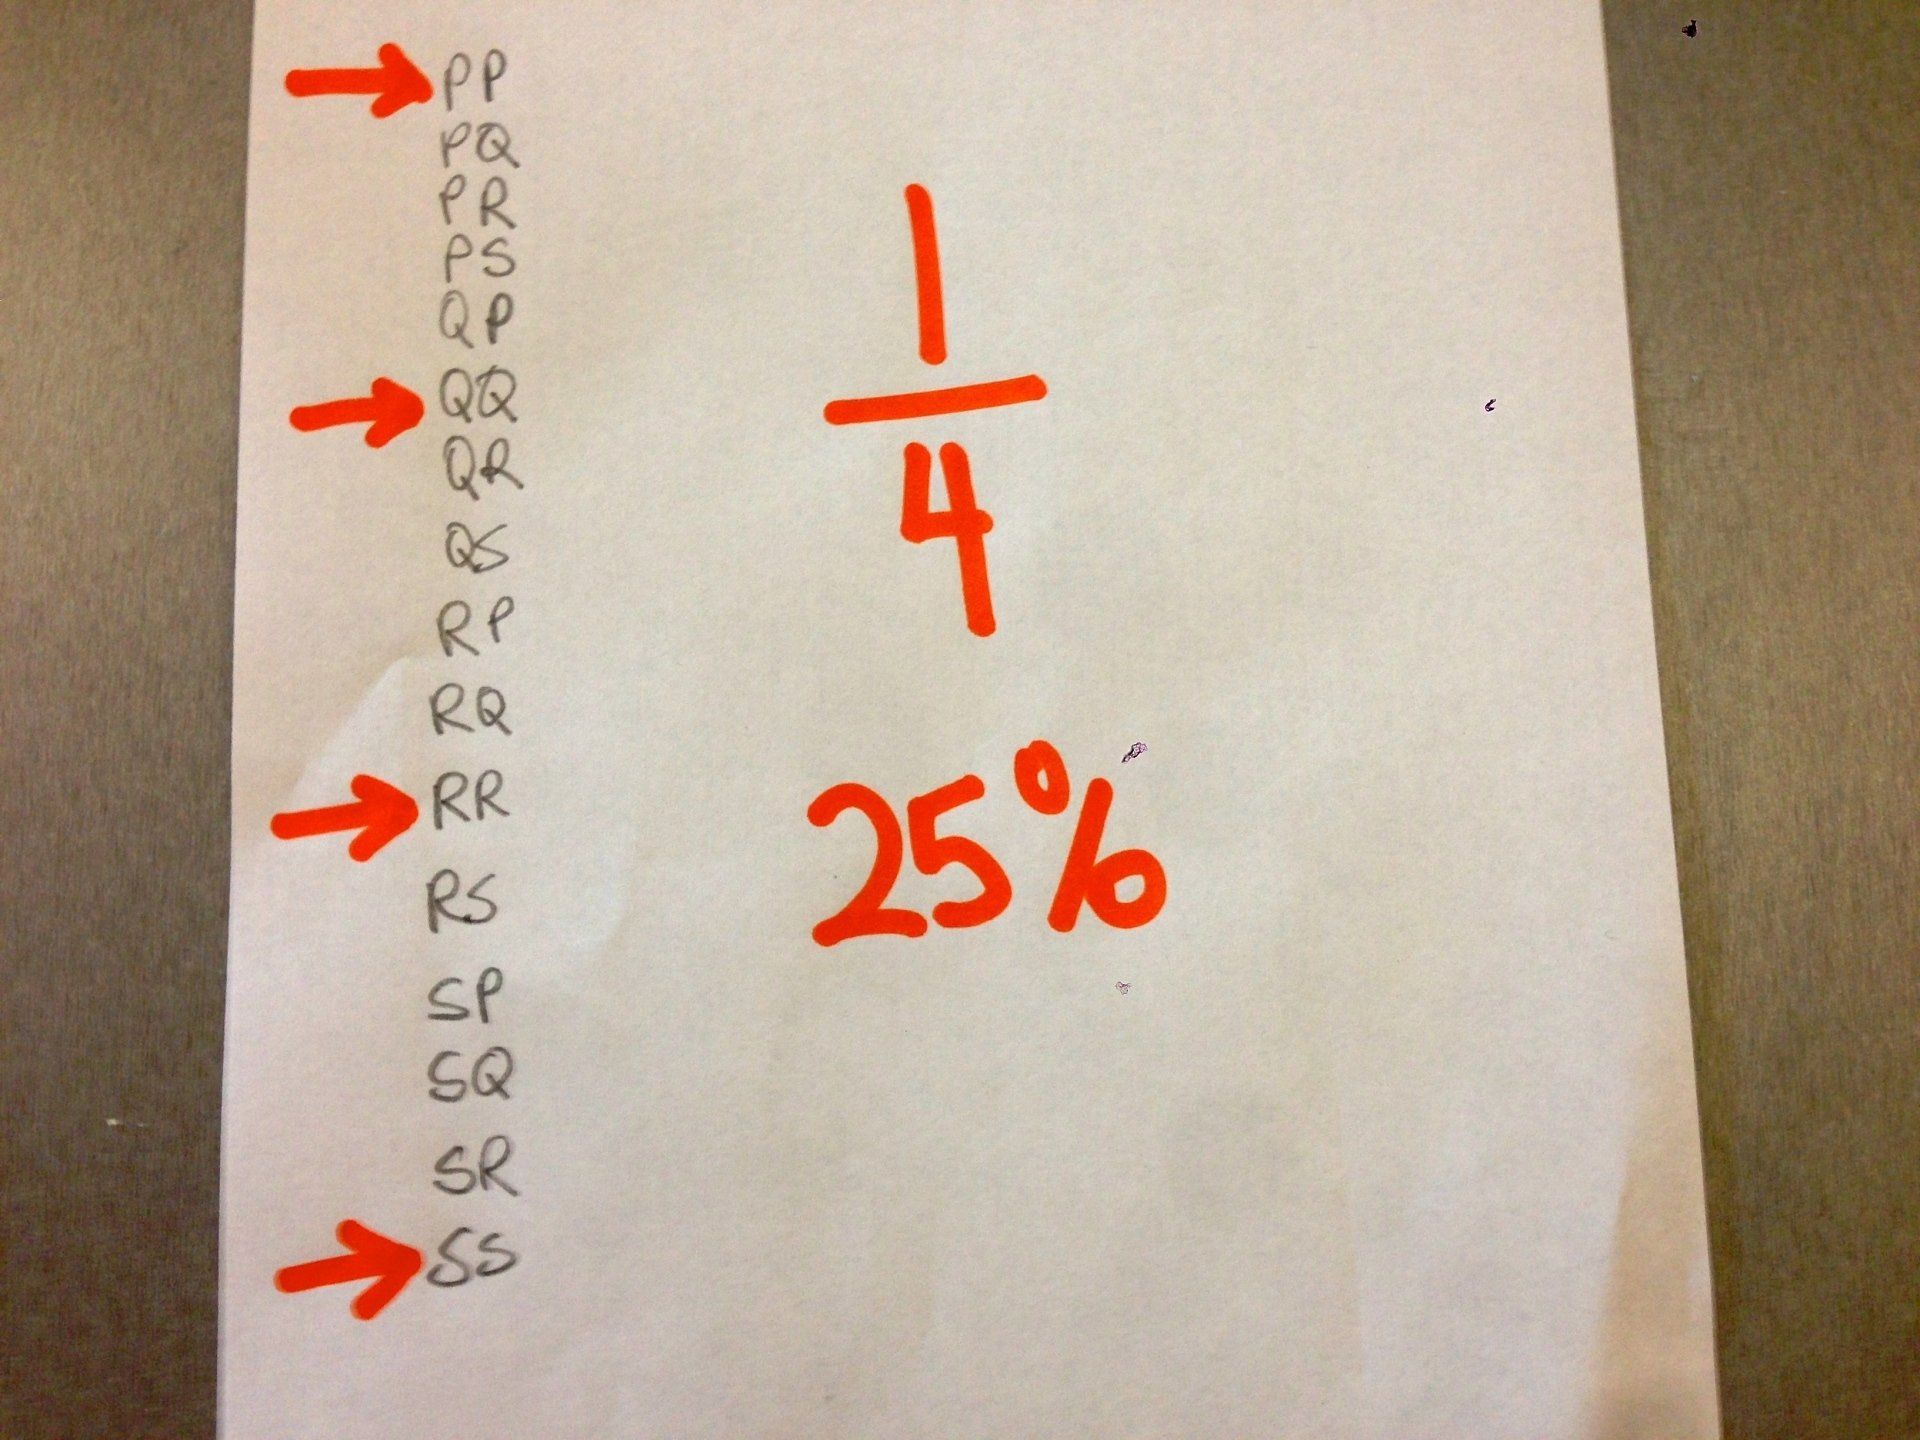
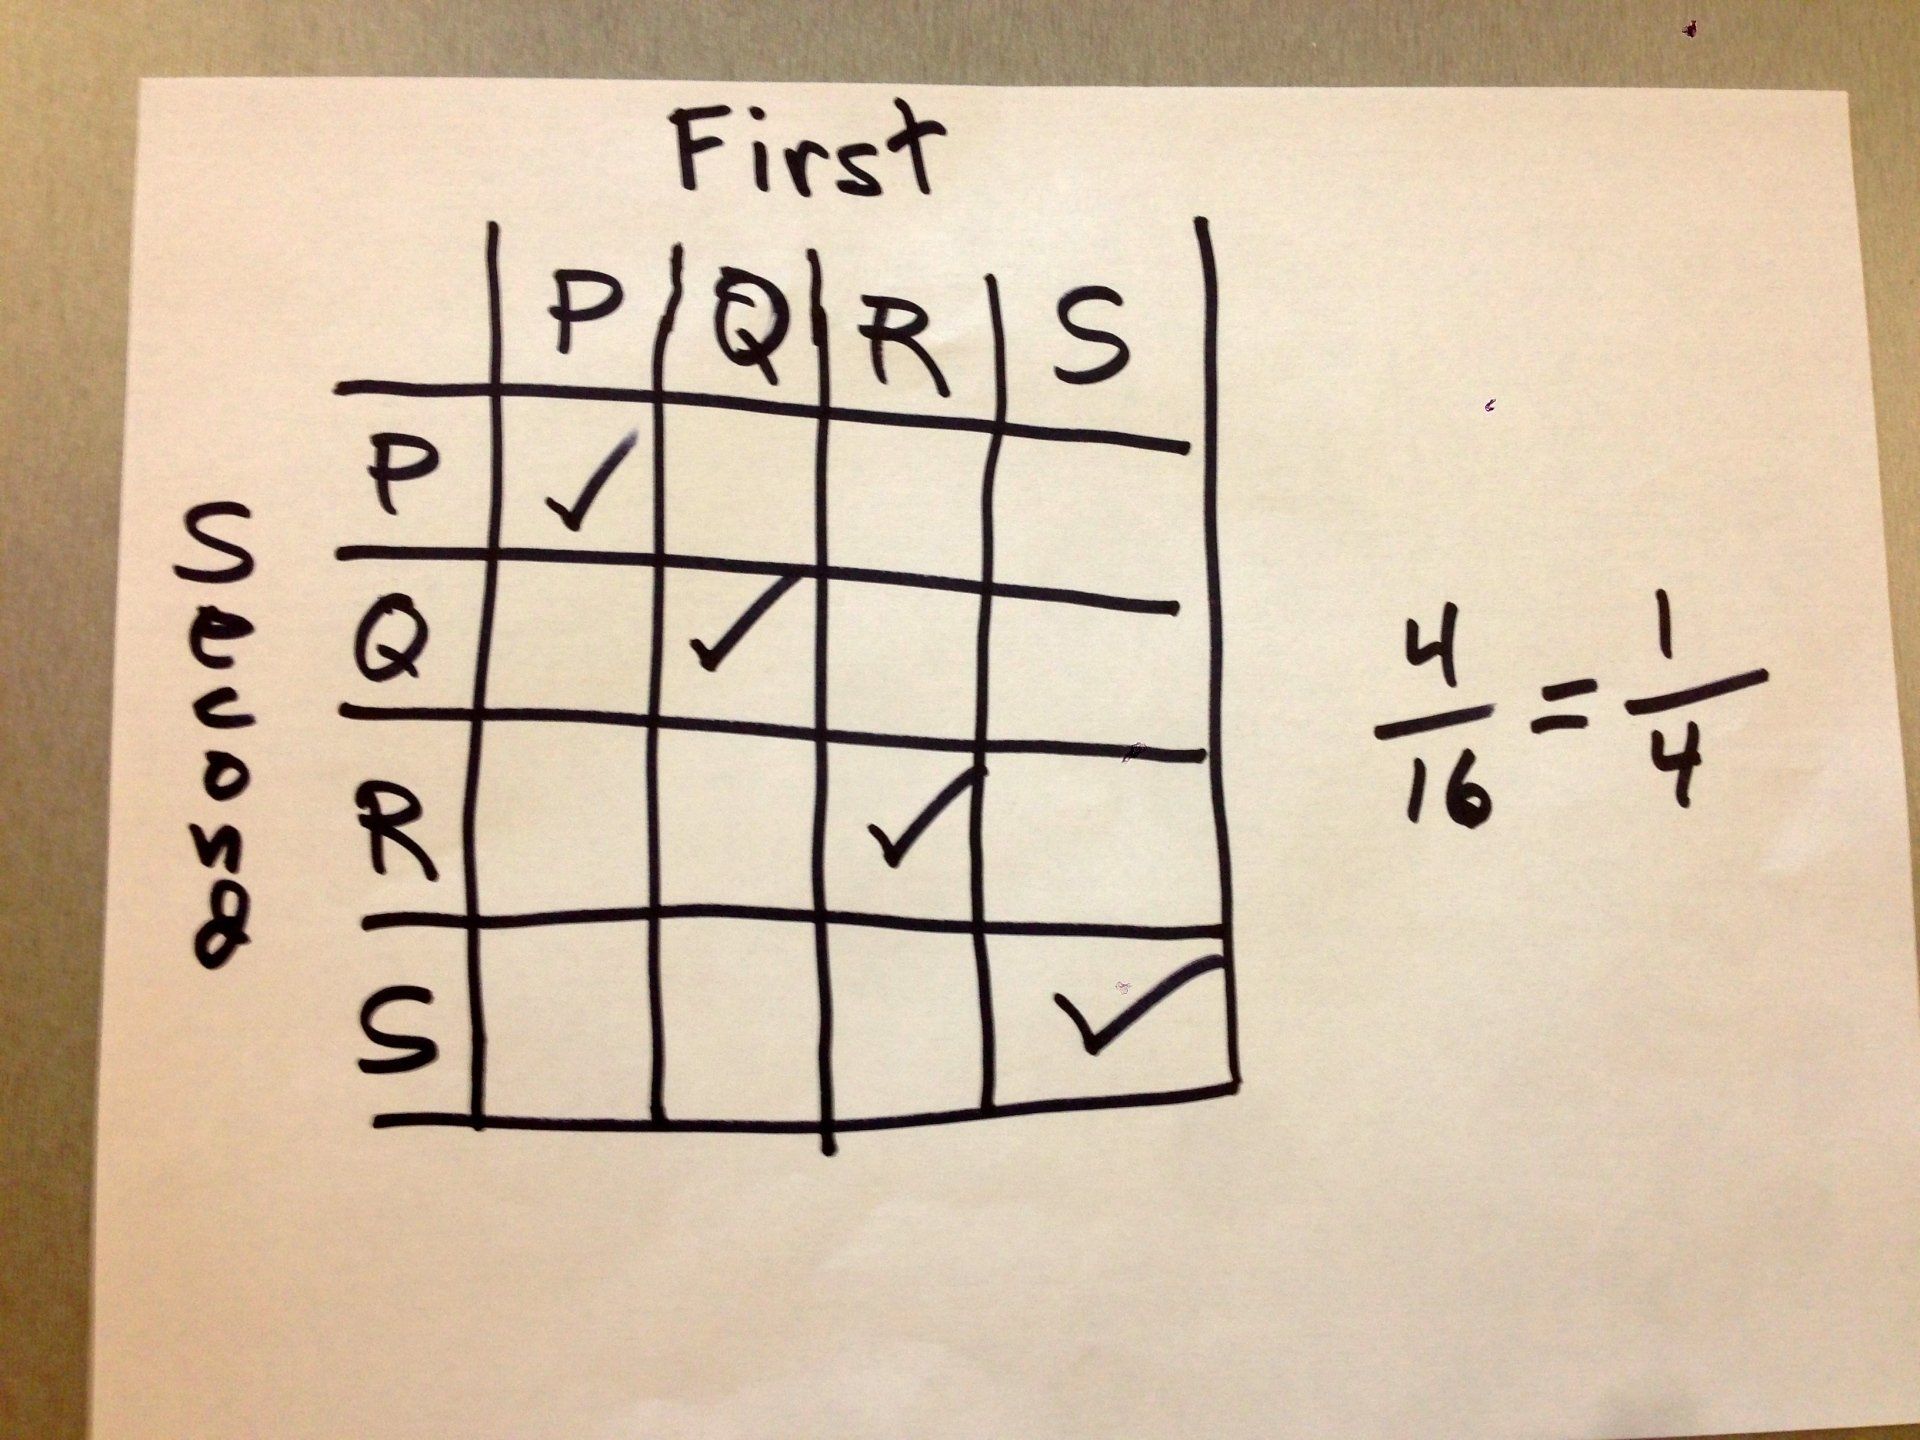
In a systematic list, students may think that “PQ” is the same as “QP” and not count it. In that case, their list may be more like: PP PQ PR PS QQ QR QS RR RS SS, which has only 10 (not 16) members, of which 4 are doubles, giving a theoretical answer of 40%. Whether this is correct is a great topic for debate; ideally, some groups did it one way, and some the other. You can then ask how we might resolve the issue. Students might suggest an empirical approach—this is a great idea. Or they might try a different theoretical representation in order to see if it gives the same result—another great idea. For example, they might re-cast their list using a different representation such as a two-way table (as in Poster C) or a tree diagram (poster E). That organization will force them to make separate entries. Then, in the wrap-up discussion, have students explain what went wrong with the first solution.
5. STRATEGIC TEACHER-LED DISCUSSION
Facilitate a discussion of the probability answers. Select a sequence of posters to use as examples during this discussion to help all students move from their current thinking up to level 4 (or beyond!).
Level 1:
Students can get the right theoretical answer (or close to it) but the list or display is disorganized, haphazard, or doesn’t clearly show their reasoning.
Level 2:
Students can develop a simulation to answer the question, but their procedure is muddled or they use only a small (less than 50) number of cases.
Level 3:
Students create a systematic theoretical result (with a clear display that shows their reasoning) or simulation (with a clear method and enough cases), but not both.
Level 4:
Students create both a simulation and a theoretical result, but do not connect the two and comment on how well they correspond.
Level 5:
Students connect their theoretical and empirical results.
Issues to raise and questions to ask across presentations
- The theoretical answers should all be the same—1/4. But the empirical answers vary. Why?
- Even though they vary, do the empirical results center on the theoretical answer? (yes, mostly)
- How do the different parts of the theoretical representations correspond to each other? (For example, where does PQ appear in each? And see the four branches in each node of the tree diagram? What do they correspond to in the table?)
- There are several ways to show the theoretical result. Which do you like best?
- There are several ways to do the simulation. Which do you like?
- How well do the theoretical and empirical answers correspond? (This varies.)
- What do you learn from the empirical results that you don’t learn from the theoretical analysis?
This is a tricky issue. It’s easy to think that the theoretical answer—¼—is “right” or “better.” Kids often feel that if they don’t get the theoretical result when they do something that involves probability, it means that their experience is somehow wrong. But it’s not! Random things vary. And at this stage, the empirical trials tell us how much.
Combining Results
To combine all the class simulation results, add the total number of “days” and the total number of “matches.” Then divide. Do not average the percentages! That only works right if every group simulated the same number of days.
Key Idea
You can determine probabilities either theoretically or empirically. If the probability you want is for some combination of events, you need to consider each event separately and combine them.
6. FOCUS PROBLEM: Same Concept in a New Context
Project Slide #4
for the focus problem and let students work on it.
Approaches and Solutions
Students can use the same theoretical strategies they did with the problem of being picked twice. A systematic list, a chart, or a tree diagram will all work.
On the theoretical side, an area chart is particularly elegant (below).
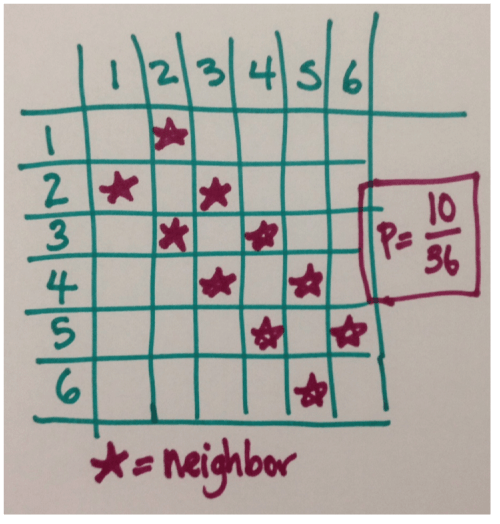
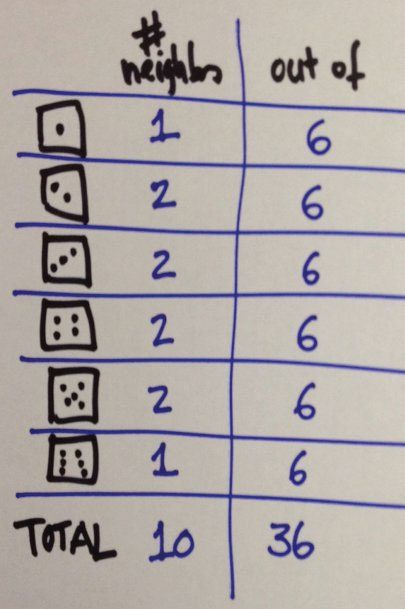
But check out the very different table solution as well. (below.) The student explained that 1 and 6 have one neighbor, but 2 through 5 each have two. For each number, those are “out of” six possibilities.
Project funding provided by The William and Flora Hewlett Foundation and S.D. Bechtel Jr. Foundation.

This work is licensed under a Creative Commons Attribution-NonCommercial-ShareAlike 4.0 International License.