

On the Download
Seventh Grade Poster Problem:Expressions and Equations
When you download movies, games, or other items with a large amount of data to your phone, the download process may take a long time to finish. But how long, exactly? This problem uses cell phone download speeds as a context for setting up and solving linear equations. The mathematical goals are to solve equations for a specific value and to represent a delayed start time meaningfully.
Downloadable Materials
Learning Objectives:
- Represent proportional relationships in equations and identify/compare constants of proportionality.
- Consider the effect of a delayed start time and represent it meaningfully in tables and graphs.
- Connect the language of a word problem or situation to an equation in the form of
- px + q = r and p(x + q) = r.
- Explore a situation that relates to a system of equations.
Common Core State Standards for Mathematics:
- 7.EE.B.4a
1. LAUNCH
Say to students, “You might remember a different problem about a dragonfly. In that problem we figured out the dragonfly could fly at 25 feet per second. Since we know the dragonfly covers 25 feet per second, the distance it flies can be described with the following equation:
distance = rate × time
“Suppose the dragonfly raced a bumble bee who could fly 10 feet per second. Which insect would win?”
Show Slide #1(video).
Elicit from students that the dragonfly would always win since the dragonfly is faster.
“How could we make this insect race more interesting? Perhaps we could give the bumble bee a head start? Would the bumble bee win if he had a head start?”
Show Slide #2(video).
Take different answers from students. You should steer the conversation to the fact that we don’t have enough information to answer this question. Key things we would need to know include the distance of the head start, and the distance of the race.
2. POSE A PROBLEM
Say to students, “Today we are going to explore a similar rate problem in a different context.
We are going to explore a problem about how long it takes to download a file on a smartphone. Have you ever downloaded a big file on a phone? What did you see? How long did it take?
Let’s watch this video of two smartphones downloading a file.”
Show Slide #3(video).
Note: Key variables that determine how long it takes are the rate that the phone can download data, and the total size of the file.
Show Slide #4.
Say to students, “The popular "mePhone" was the best smart phone ever when it came out. With the mePhone, you could send emails and text messages, browse the web, watch videos, listen to music, download your homework from the cloud, update your status online... oh, and you could even make phone calls!”
“The mePhone is pretty fast. But the new and improved mePhone2 can download data even faster than the original mePhone. “
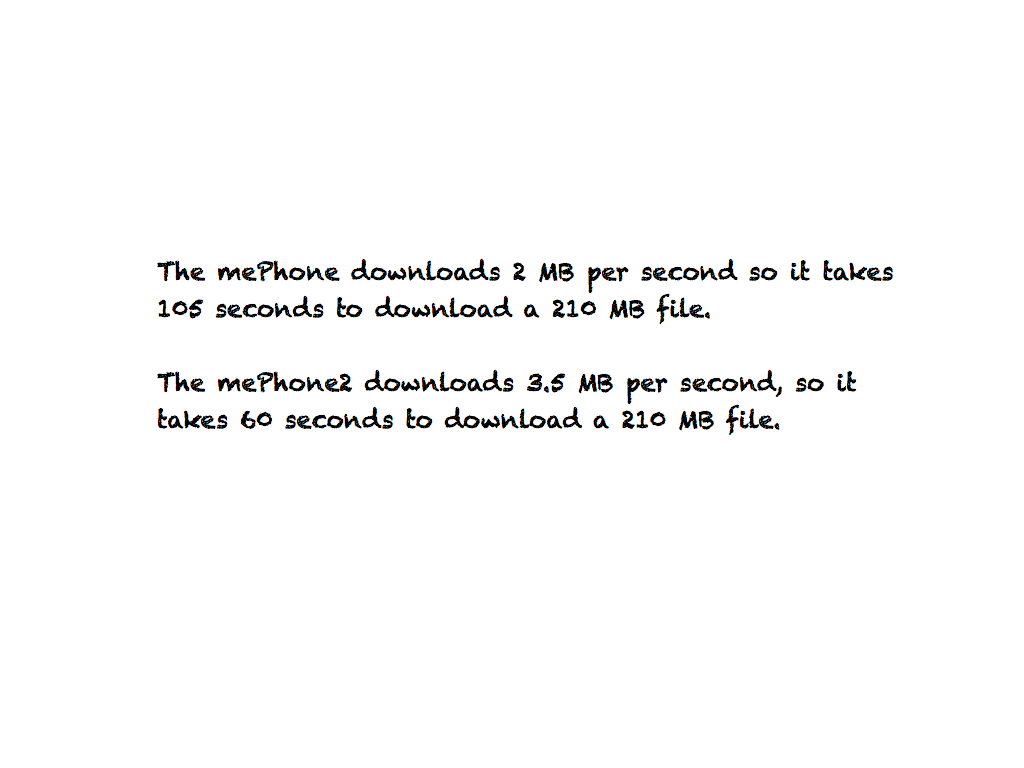
“The mePhone can download 2 megabytes of data per second. The mePhone2 can download 3.5 megabytes per second.”
Distribute Handout #1.
Handout #1 Answer Key
This handout is a model of a situation: You begin downloading a large file on your mePhone. It is taking a long time. 30 seconds after you start downloading, your brother starts to download the same file on his mePhone2.
Ask, “Does everybody understand this situation?” Take questions and review the key information as needed.
After students have completed the handout, ask, “What do you notice about the data column for the mePhone2?”
Elicit that the rows show zero data for the mePhone2 for times from 0 to 30. Also, the table does not show the mePhone2 surpassing the mePhone, but students may offer that it is a possibility.
3. WORKSHOP
Show Slide #5.
Say to students: “Create a poster comparing how the data was downloaded by each phone in Handout #1, but consider that the file they were downloading was a 210 MB video.
"Use t
to represent time in seconds and d to represent downloaded data. You may create an explanation that uses words, a table, an equation, a graph... Or some combination of these representations! Be sure your poster answers the following questions:"
- How long did the phone take to download the file?
- Which phone will finish first?
- Where do we see the rate of each phone’s download?
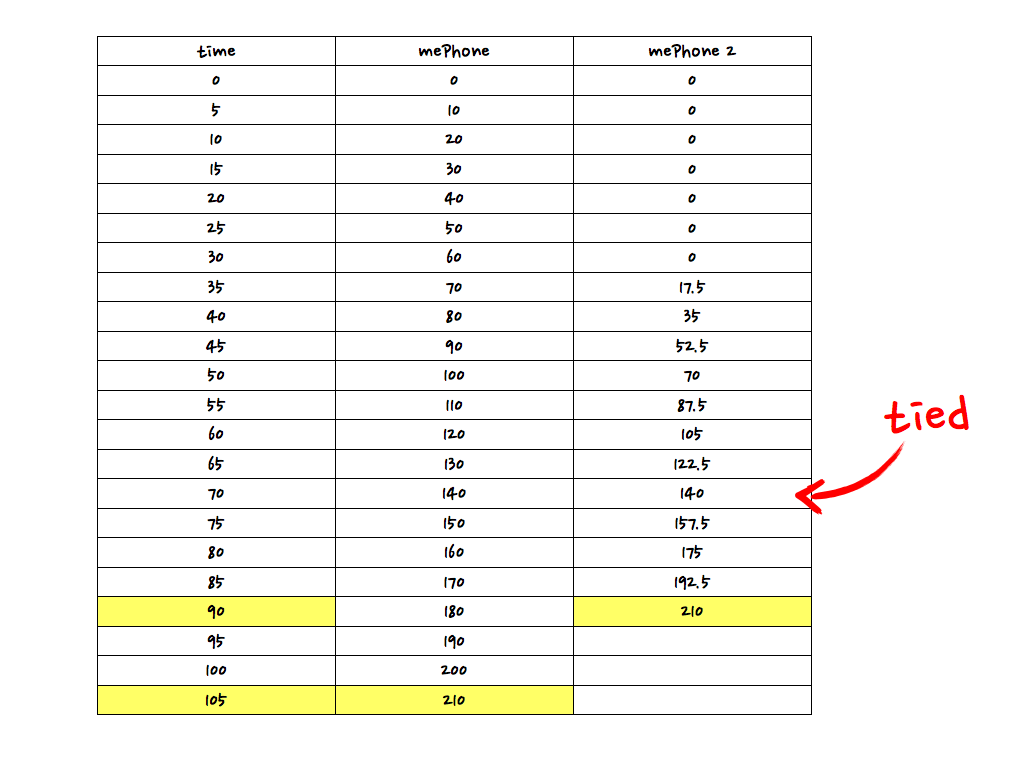
- When (if ever) were the two phones “tied”? How do you know?
4. POST, SHARE, COMMENT
Sample Posters
5. STRATEGIC TEACHER-LED DISCUSSION
Your next step is to facilitate a discussion of the probable answers. Select a sequence of posters to use as examples during this discussion to help all students see a variety of good thinking.
There are several effective approaches. The ideal is that students be fluent with each, and can connect them. That will be your goal in engineering the discussion. The “levels” below address the approaches separately: tables, graphs, and equations—but encourage groups that use more than one of these and coordinate them.
Table Levels
- T0: No table of values.
- T1: Tables that are correct but do not account for the 30-second delay or help find the “tie” point.
- T2: Single table accounts for the 30-second delay.
Graph Levels
- G0: No graph.
- G1: Graph does not account for the delay.
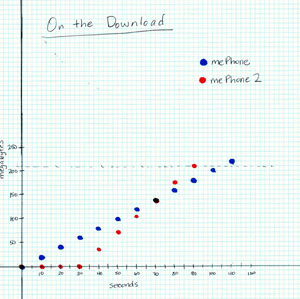
- G2: Graph accounts for the delay. It shows points (as from a table) and lets you correctly find answer to the questions about who won or when they tied.
- G3: Graph shows lines, and shows (on the graph or though equations attached to the graph) that the slopes are the two data rates. May deal with the time before 30 seconds.
Equation Levels
- E0: No equations
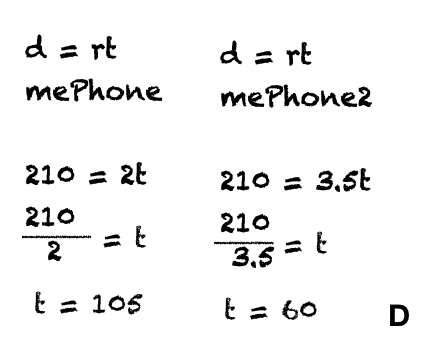
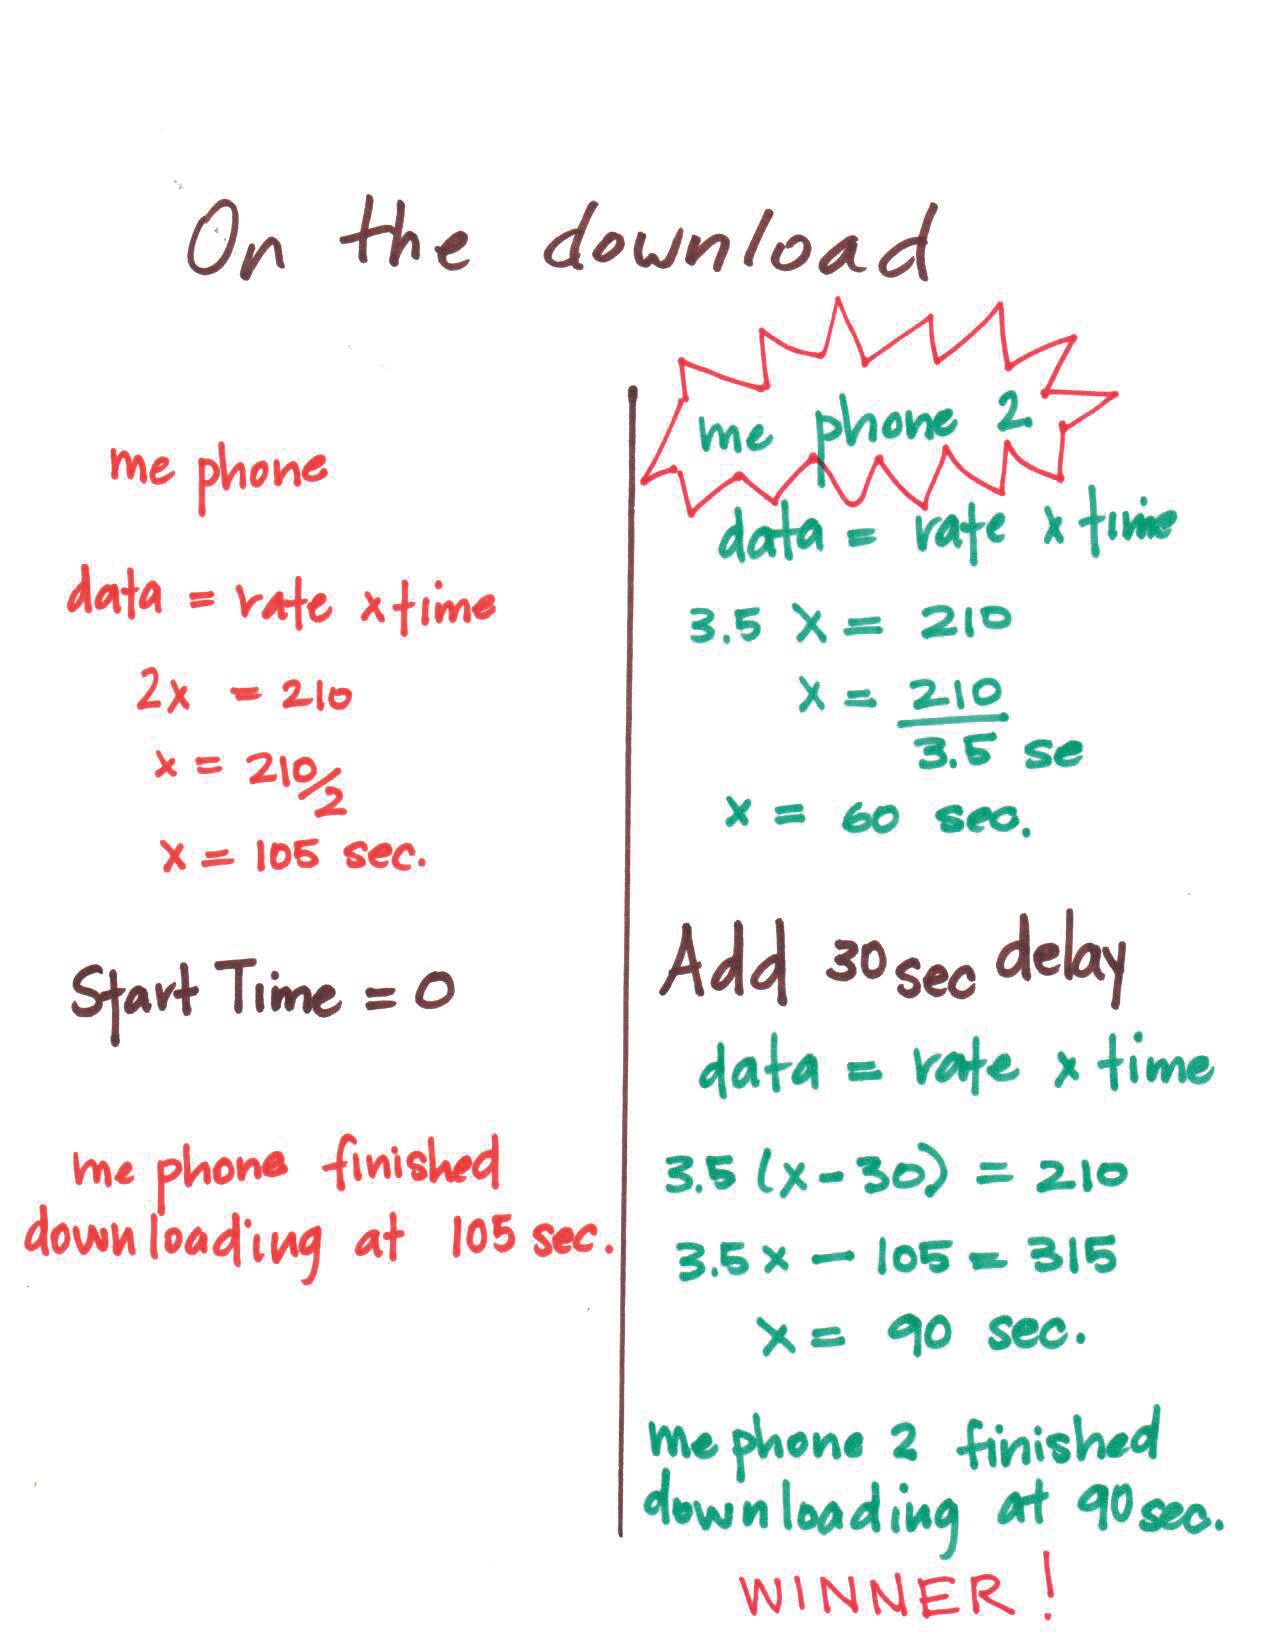
- E1: Equations based on d = rt, with no accounting for the delay. Note that students can still account for the delay “after the fact,” i.e., getting an answer of 60 for the mePhone2 and adding 30 seconds.
- E2: Two equations; the mePhone 2 version accounts for the delay (d = 3.5(t – 30)). Group plugs in 210 MB and solves to find the two times.
- E3: Like E2 but includes solving for the “tied” time (70s, 140MB) by setting the two equal to each other and solving.
Questions to ask across presentations
- Where is the data rate (2 or 3.5 MB per second) in your display?
- How can you tell when they’re tied? [ See the intersection on the graph; solve 2t = 3.5(t – 30). ]
- What happens to the mePhone 2 before 30 seconds? How do you show that in your display?
- What are the advantages of using an equation? A graph? A table?
- Suppose the mePhone 3 has a data rate of 7.5 MB per second. Which technique would make it easiest to solve a new problem with the mePhone 3? [ The equations: you only have to swap out one number.]
6. FOCUS PROBLEM: Same Concept in a New Context
Distribute Handout #2.
Handout #2 Answer Key
The Focus Problem Challenges students to extend the rate equations to include reasoning about the cell phone plan required to use the phones.
Project funding provided by The William and Flora Hewlett Foundation and S.D. Bechtel Jr. Foundation.

This work is licensed under a Creative Commons Attribution-NonCommercial-ShareAlike 4.0 International License.