Problems with Different Start Points and Different Speeds
Let's think about problems like On the Download, in which things move or change but have different start points and different speeds. This kind of problem comes up a lot… trains, head starts in a footrace, etc. Ultimately we want students to be able to graph the situation to help them understand the problem and solve it.
When people want to make fun of school math, they often start with the phrase, “A train leaves Chicago…” It’s a stereotypical math problem, as common as the joke stem, “A guy walks into a bar.” Let's pursue this: what's in the train problem?
First, there’s always another train—or a plane, or something—moving at a different speed, starting at a different place or time, and the question almost always asks when or where the trains will meet, or possibly which one will get to Omaha first. Even though it's not about trains, On the Download is isomorphic to these train problems: it’s exactly the same except that miles become megabytes and hours become seconds.
Notice that we also assume that the trains (and the downloads) are traveling at constant speeds. That means that the graphs and equations we will use are linear. It’s all x. No x-squared, no exponents, no square roots. When we make graphs, the graphs will all be straight lines.
What makes the problem hard? The delay. You wait 30 seconds to start the mePhone 2. What trouble does that cause?
- Many students, if they start by making a table, will make two separate tables, one for each phone, showing how much data was downloaded for different times. So after 10 seconds, one table might show the mePhone as having downloaded 20 MB and the other table will show the mePhone 2 as having downloaded 35 MB. That’s correct, but not useful: the times are not the same times. After all, at 10 seconds, the mePhone2 has not even started!
- Similarly, many students can recite “distance equals rate times time” and realize that you can write formulas for the downloaded data: D = 2T for the mePhone and D = 3.5T for the mePhone 2. But that doesn’t take the delay into account either; in fact, it’s the same as making the two separate tables. It’s hard to use those formulas to understand the whole situation.
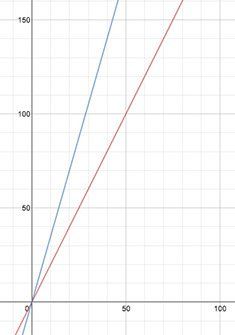
- If you graph those two equations, you see the graph at right, which has all the same problems as the table and equations: nice graph, but what do you do with it? How does it represent the delay?
Each of these three perspectives needs to take the delay into account. In the table, the student must have the insight (or the scaffolding) to make a single table with one column for time—the time since the first download started—and two additional columns, one for each phone, that show how much data each phone has downloaded since the first one started. The second phone’s numbers will be 0 for the first 30 seconds.
Suppose you use formulas. In the formula for the mePhone 2, we might have the insight that the phone has had thirty seconds less time to download than the slower model, so instead of D = 3.5T it should be D = 3.5(T – 30).
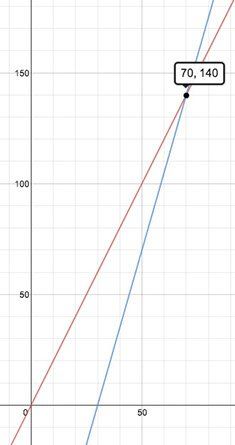
Graphically, we might reason that the steep graph should intersect the horizontal (T) axis 30 seconds later, that is, farther to the right: we want the x-intercept (not the y-intercept!) to be 30. And if we plot the formula with a tool (such as the Desmos graphing calculator), that’s exactly what we see.
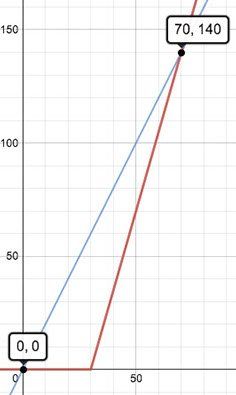
The graph is a terrific representation. It shows, for each moment in time—each vertical slice—how much each phone has downloaded. And it shows, for each amount of download—each horizontal slice—when each phone will get there. For example, you can read off the graph that to download 50 MB, it takes about 25 seconds for the mePhone. The mePhone 2 takes longer: it has downloaded 50 MB about 45 (or a little less) seconds from the start.
The graph also shows the intersection at (70, 140). Ask the students what that intersection means: that at 70 seconds (since the first phone started) both phones will have downloaded 140 MB. That is (and this is the whole point), if the file is 140 MB or less, the mePhone will finish first. Any bigger and the mePhone 2 will finish first: it was worth it to start the new download.
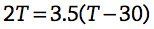
This leads us back to a symbolic strategy. We can find the intersection without the graph, but we need to understand that this occurs when the two values for y (which we called D above) are the same. When that’s true, we can set the two expressions from the right-hand side equal to each other and find the value of T (the time, the x-variable) so that
Solving this equation with algebra is within reach of seventh-graders, but truly understanding why this is the equation you need to solve (and then plugging the time back in to get the file size) is asking a lot.
In a real classroom, we expect a wide range of strategies the first time through. We might be tempted to give students the “right” procedure to help them solve the problem quickly, but the modeling process should include iteration and improvement. We want students to persevere through trial and error, a skill they will need for real problems, which are usually less clearly defined and much more messy. And remember: it takes plenty of insight to make a good table.
Connecting to understanding of functions
High-school students who appear to be fluent in algebra and with linear functions don’t always have all the relevant tools at their disposal. For example, most of them know y = mx + b, where m is the slope and b is the y-intercept. But in our problem the important quantity is the x-intercept! How do we find the x-intercept? This is a good place to know about the point-slope form of the equation for a line,
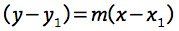
which is the line of slope m through the “anchor” point (x1, y1). For the fast phone, that point is (30, 0) and the slope is 3.5 (MB per second), giving us our equation, y = 3.5(x – 30).
We don’t see the point-slope form in math problems as often as slope-intercept, but in many ways it’s conceptually richer. After all, if our “anchor” point is (x1, y1), we could write it as
(the y-distance from the anchor point) = m (the x-distance from the anchor point)
which is practically a definition of slope.
We can look at the problem another way, using transformations. The faster phone uses the function D = 3.5T, but translated 30 seconds to the right. And how do we do that? Replace T with (T – 30).
All of that doesn’t hit these students until high-school mathematics—but having experience exploring problems like this one will be good background.
Plausibility and relevance
The problem with the two phones is at least more plausibly worth caring about than the local train leaving Chicago at noon, and the express leaving at 3 PM. But problems like these are important because they’re about the relationship between two linear functions.
Situations with constant rates involve linear functions, so any time you have two rates going on, you have a chance for one of these problems to arise. And it doesn’t have to be rates; sometimes problems arise wholly geometrically. If you’re writing software for some graphical phenomenon (where will the photon torpedo hit the space station?) you’ll end up creating and solving equations very similar to these, but with curves instead of lines.
Another question is about the delay. Why is the delay important?
First, students may be accustomed to situations that use direct proportion. The mePhone scenario is a way to take one of those (e.g., distance = rate times time) problems and alter it so that it’s still linear—there’s a constant slope—but it’s no longer direct. Its graph doesn't pass through the origin. This helps students develop skill with more complicated formulas, and also helps them recognize when a situation doesn’t fit the easy case, and starts giving them strategies to cope with it. Importantly, problems with delays give students a chance to break away from reflexively using a formula (d = rt) and really think about the mathematics: what’s changing? What do I know? How shall I represent each part of the problem? Does what I’ve written make sense so far? Where should I put t = 0?
What we’ve swept under the rug
Here’s a big issue: what do you do about the time during the delay? In On the Download, what about the formula for the mePhone 2 when the time T is less than 30 seconds? For example, at 20 seconds, if we plug into the formula, we get
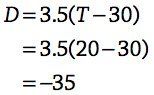
Our formula is only relevant for T ≥ 30. We often ignore this problem, but it’s worth bringing up if you can. It’s an issue of domain: our mathematical descriptions are often limited. The word domain (the students don’t need to know it yet) refers to the relevant “input” values for whatever function you’re looking at. Another example is inverse proportion: if you have y = k/x, it only makes sense if x ≠ 0. So 0 is not in the domain.
You can still make the graph, though, and write the formula. A more complete formula for D would be:
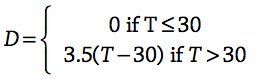
And a graph might look like the one at right. See how the function follows the axis from zero to 30? This is called a piecewise function. The way you tell the computer to draw such a thing depends on the particular graphing utility you’re using.
Another famous piecewise relationship is absolute value, y = |x|.