
Getting Insight from Graphs
We often think of a graph as a visualization that comes near the end of an investigation. But as students get more comfortable with graphs and their equations, they can use graphs to get insight into mathematical relationships.
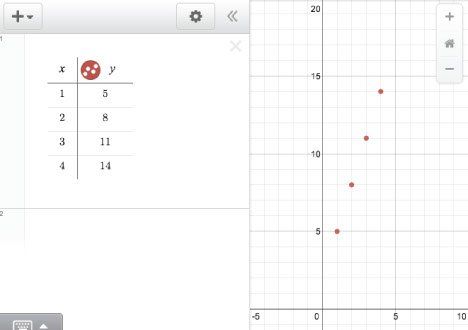
Here’s an example: suppose we have a number sequence: { 5, 8, 11, 14… } and we want to know the 100th number in the sequence.
There are many ways to solve this problem, but let’s use a graph.
Here we’ve used the free Desmos graphing calculator (http://www.desmos.com/calculator), but for this problem, grid paper and a pencil work fine.
First we made a table of our values (left side of the illustration). They’re plotted on the graph. We can see the points form a line, and we can count squares to find the slope (3) and intercept (2).
So if we plotted y = 3x + 2, the resulting line should go through the points—and sure enough, it does:
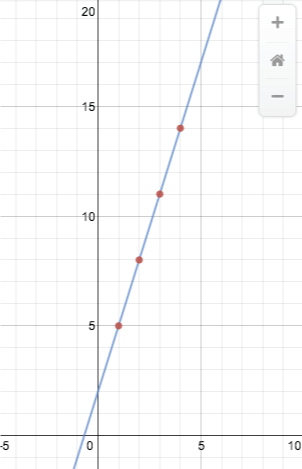
That means the 100th number in the sequence is 3(100) + 2 or 302.
The key is that our understanding of graphs and their equations made figuring out the formula easy.